Search "Azusa home prices" this month and you'll get answers that contradict each other. One site says values jumped double digits over the past year. Another says single-family prices fell by nearly a fifth over that same stretch. A third says prices have barely moved in three years. All three are pulling from real closed sales. None of them is wrong.
The reason isn't bad data. It's that Azusa's home sales are being reported through very different windows, on very different sample sizes, and the city itself is quietly running two housing markets at once: an older single-family stock that's cooling, and a wave of new transit-adjacent construction that's pulling numbers the other direction. If you're comparing Azusa to another San Gabriel Valley city on price alone, that split matters more than any single median you'll find.
Four Trackers, Four Different Stories
Here's what a handful of the major sources were showing as of this writing, each measuring something slightly different:
| Source | Time Window | What It Measured | Change |
|---|---|---|---|
| Redfin | December 2025 | Median sale price of $775,000 | Up 10.7% year over year, but on just 12 homes sold, down from 25 the year before |
| PropertyShark | Q1 2026 | Single-family median of $675,000; condo median of $628,000 | Houses down 18.4% year over year; condos up 9.2% |
| CRMLS-based single-family tracking | August 2026 | Median of $743,300 | Up 1.6% year over year, down 2.0% from July |
| Twelve-month closing data | Trailing year through August 2026 | Median of $670,000 across 304 closings | Middle half of sales closed between $515,000 and $835,000 |
Look at the sample sizes before you look at the percentages. Redfin's December figure is built on 12 transactions. PropertyShark's quarter had 52, itself down 17.5% from the year before. In a city with roughly 50,000 residents, a handful of high-end canyon sales or a cluster of new-construction closings can swing a monthly or quarterly median by tens of thousands of dollars without the underlying market actually shifting. That's not a flaw in any one tracker. It's what happens when you measure a small market in small windows.
The more useful split isn't month over month. It's the one PropertyShark's Q1 2026 numbers accidentally surfaced: houses and condos in Azusa are not moving in the same direction. That's the real story, and it traces back to where new construction is actually happening in the city.
The City Is Building Two Different Housing Markets
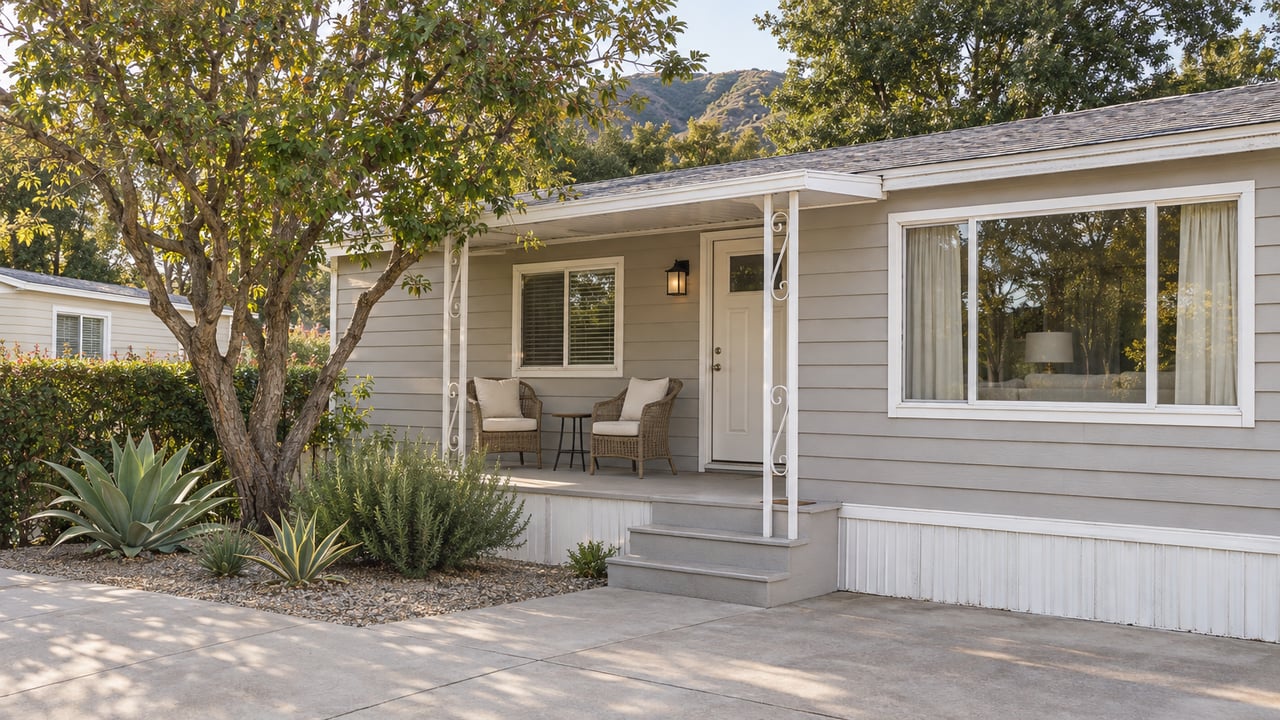
Most of Azusa's existing single-family stock sits south of the 210, in older tract neighborhoods built for a blue-collar workforce, many of them under 1,500 square feet on roughly 5,000 square foot lots near industrial employers like the Northrop Grumman facility. That stock is what's showing up as flat to soft in the PropertyShark and Hanson Homes numbers. It's not deteriorating. It's just not the part of the city where new supply is landing.
The new supply is clustering around Azusa's two Metro A Line stations, both of which opened for passenger service on March 5, 2016. The Azusa Downtown station sits in the heart of downtown on Alameda Avenue. The APU/Citrus College station anchors the city's eastern border near Azusa Pacific University and Citrus College. Since those stations opened, two projects have reshaped what "new construction near transit" means in Azusa:
- Lumia, a mixed-use development at 826 N. Azusa Avenue, completed in August 2024 immediately adjacent to the Azusa Downtown station. It added 127 apartments and roughly 12,000 square feet of ground-floor retail, the kind of product that didn't exist downtown a decade ago.
- Rosedale, a 518-acre master-planned community approved for 1,500 residences next to the APU/Citrus College station, built around a "transit village" concept with a community park, sports fields, and a planned K-8 school. Rosedale is also home to Mountain Cove, a smaller enclave of roughly 300 craftsman-revival homes that consistently prices above the rest of the city because of its canyon-adjacent setting and larger lots.
When PropertyShark's Q1 2026 numbers show condo prices up 9.2% while houses fell, this is very likely what's driving it. New-construction condo and townhome product near the stations is trading at prices the older single-family stock south of the freeway simply isn't built to match. The citywide median blends both markets into one number, which is exactly why that number keeps moving around depending on which quarter, which segment, and which handful of closings a given tracker happens to catch.
What This Means If You're Comparing Neighborhoods on Price
If you're cross-shopping Azusa against Glendora, Duarte, or Monrovia using a single median price, you're comparing an average of two different products to a single product elsewhere. A buyer looking at a 1950s tract home south of the 210 is shopping a different market than a buyer looking at a unit near Rosedale or a townhome close to the Downtown station, even though both show up under the same city name on a listings page.
Price per square foot tells a steadier story than the median dollar figure does. Depending on the tracker, that number has held in the $450 to $475 range through most of 2026, which is a tighter band than the swings in headline median price would suggest. If you're trying to sanity-check a listing against the broader market, price per square foot for a comparable property type in a comparable part of the city is a more stable anchor than the citywide median of the month.
It's also worth knowing that Azusa continues to trade at a meaningful discount to the broader Los Angeles County median, which several sources placed north of $850,000 in the same period Azusa's single-family median sat in the $670,000 to $745,000 range. That gap is part of why buyers priced out of cities further west in the valley keep looking east toward Azusa in the first place.
The Inventory Number That's More Reliable Than the Price
Days on market and months of supply also vary a bit by source, but they tell a more consistent story than price does. Homes were sitting roughly 45 to 65 days on average through much of 2026 depending on the tracker, and one August 2026 reading put active inventory at 44 homes, up slightly month over month but still down about 10% from a year earlier. Months of supply sat around 3.2, which is the kind of number that still favors sellers but is drifting toward a more balanced market rather than staying locked in seller's-market territory.
That drift matters for both sides of a transaction. A seller listing an older single-family home south of the 210 shouldn't assume the pricing momentum from a new Rosedale-area sale down the street applies to their listing. A buyer eyeing a resale near one of the Gold Line stations should expect more competition than the citywide days-on-market figure implies, since that number is being pulled down by the tighter, more sought-after transit-adjacent segment.
A Few Direct Questions
Which number should I trust when comparing Azusa to another San Gabriel Valley city? None of them in isolation. Use price per square foot for a similar property type and location within Azusa, and treat the citywide median as a rough starting point rather than a fixed figure, since it's blending single-family and condo markets that are currently moving in different directions.
Does buying near a Gold Line station guarantee better appreciation? Recent data shows new construction and condo product near the stations outperforming the broader single-family median in the short term, but three-year figures for Azusa's single-family market overall show appreciation has been slow and steady rather than dramatic. Location near transit is one factor among several, not a guarantee on its own.
Is now a buyer's market or a seller's market in Azusa? As of mid-2026, months of supply sit around 3.2, which still leans toward sellers but is closer to balanced than it's been in recent years. That's worth discussing property by property rather than assuming the citywide inventory trend applies evenly to every part of town.
If you're trying to make sense of what a specific Azusa property is actually worth against this backdrop, or how it compares to something you're considering in Glendora, Monrovia, or elsewhere in the San Gabriel Valley, that's exactly the kind of property-by-property read Mel Macklin does for buyers and sellers across these neighborhoods every week. Let's Connect.